Features / Impact Analysis & Visualization
Understand Dependencies. Visualize Architecture. Monitor Health.
Three capabilities that turn raw architecture data into decisions: impact analysis tells you what breaks before you change it, live diagrams show the real state of your landscape, and the health dashboard gives leadership the numbers they need. All built on the same data — no manual syncing, no stale reports.
Impact Analysis
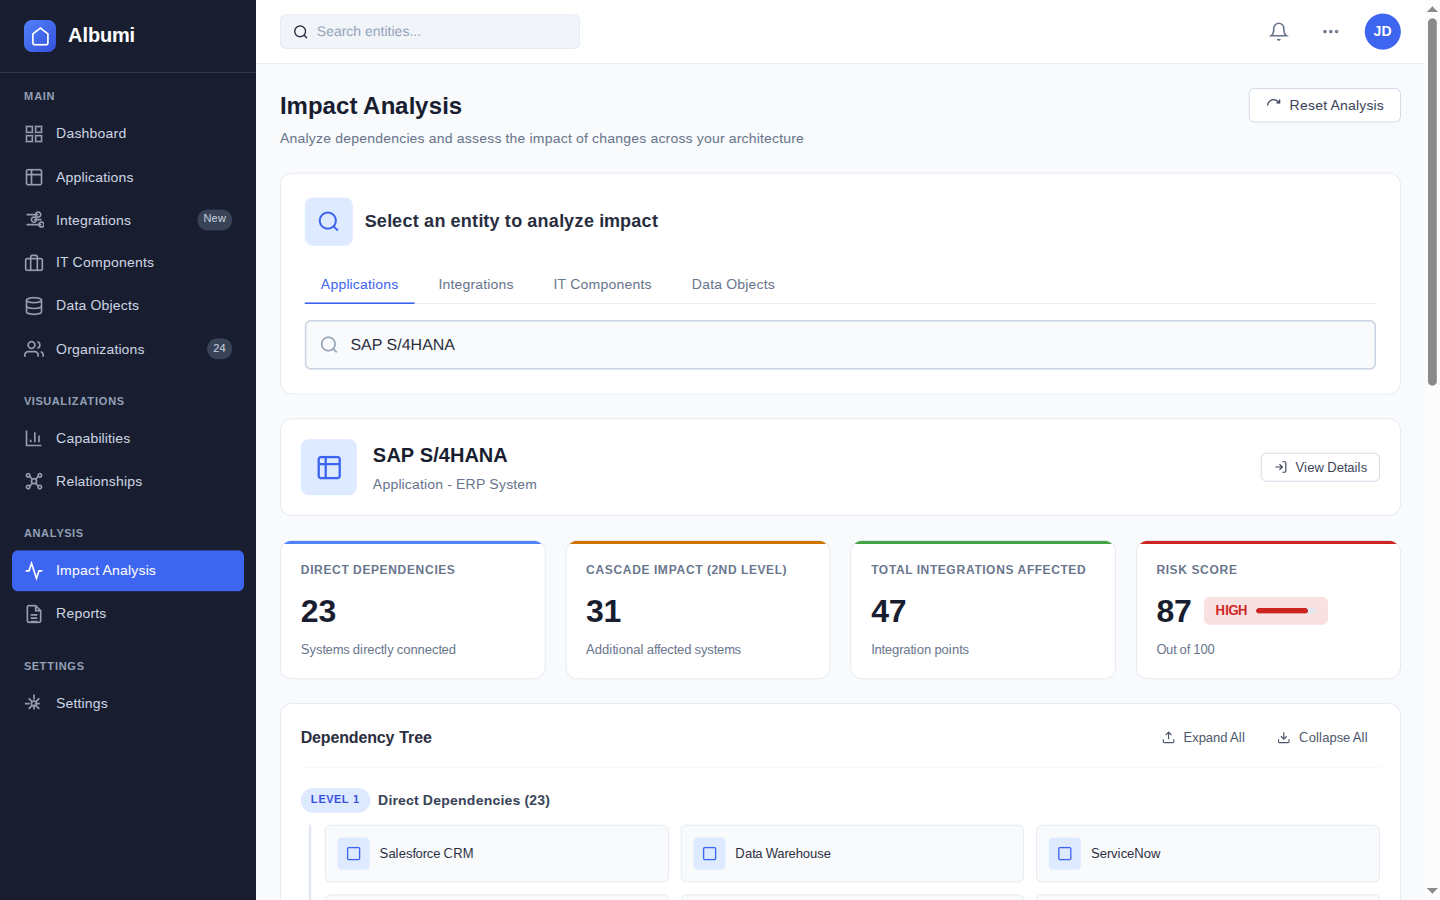
"What breaks if I change this?" is the most important question in enterprise architecture. Every migration, decommission, and technology sunset starts here. In Albumi, you select any application, integration, or data object and instantly see its complete dependency map with calculated risk levels.
Dependency Graph
See every entity connected to your target — applications that depend on it, integrations that flow through it, data objects it owns, business capabilities it supports, and IT components it runs on. The full picture, not just the parts someone remembered to document.
Risk Assessment
Each impact analysis comes with a calculated risk level — critical, high, medium, or low — based on the number and criticality of affected entities. A system with 2 non-critical consumers is a different conversation than one with 15 integrations and PII data.
Affected Entity Breakdown
Get a structured list of everything at risk: affected applications, integrations that will break, data objects that need a new System of Record, and business capabilities that will lose coverage. Each with its own criticality level.
Data Objects at Risk
See which data objects are owned by the target system. If you decommission it, those data objects need a new System of Record — especially critical for PII and confidential data.
Business Capability Impact
Understand which business capabilities lose support if a system goes away. This connects technical changes to business outcomes — the language that leadership understands.
Architecture Diagramming
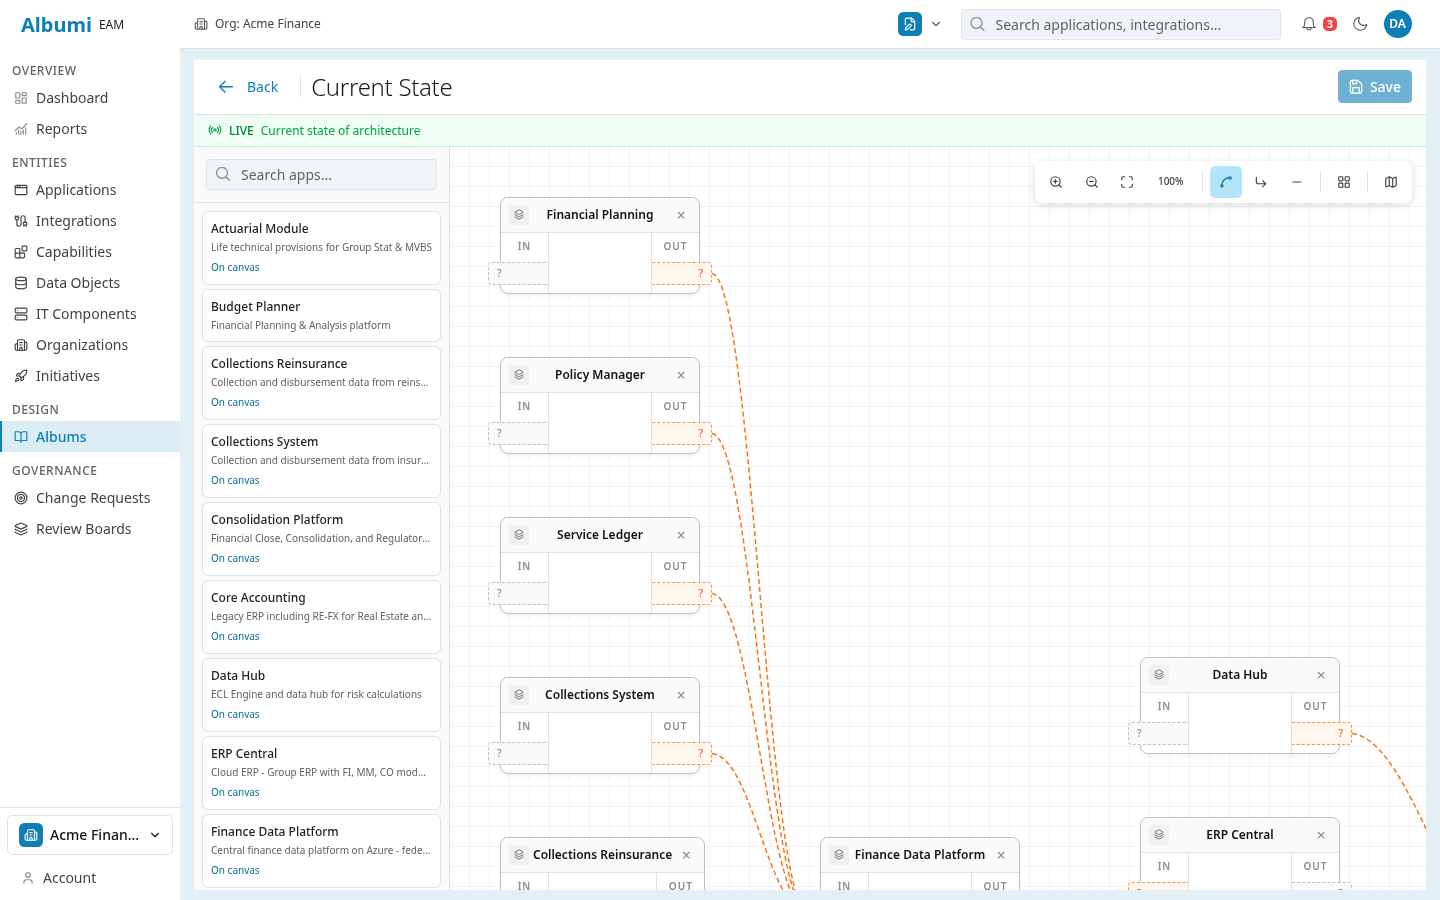
Static diagrams in Visio or PowerPoint go stale the moment you save them. Albumi generates diagrams from live data — every node is a real application, every edge is a real integration. When you add a new integration or decommission an application, the diagrams update automatically.
Integration Map
A visual map of all application connections in your landscape. See which systems talk to each other, through which integrations, and via which protocols. Filter by organization, lifecycle status, or technology to focus on what matters.
Data Lineage Graph
Follow any data object from its System of Record through every integration to every consuming application. A visual graph that makes data flows tangible — perfect for compliance conversations and migration planning.
Dependency Graph
Select any application and see its full dependency tree — upstream systems it depends on, downstream systems that depend on it, and the integrations connecting them all. The visual foundation of every impact analysis conversation.
Auto-Update
Diagrams reflect the current state of your architecture data. No manual redrawing — add an integration in the catalog, and it appears on the map. Retire an application, and the diagram updates. Always current, always accurate.
Architecture Health Dashboard
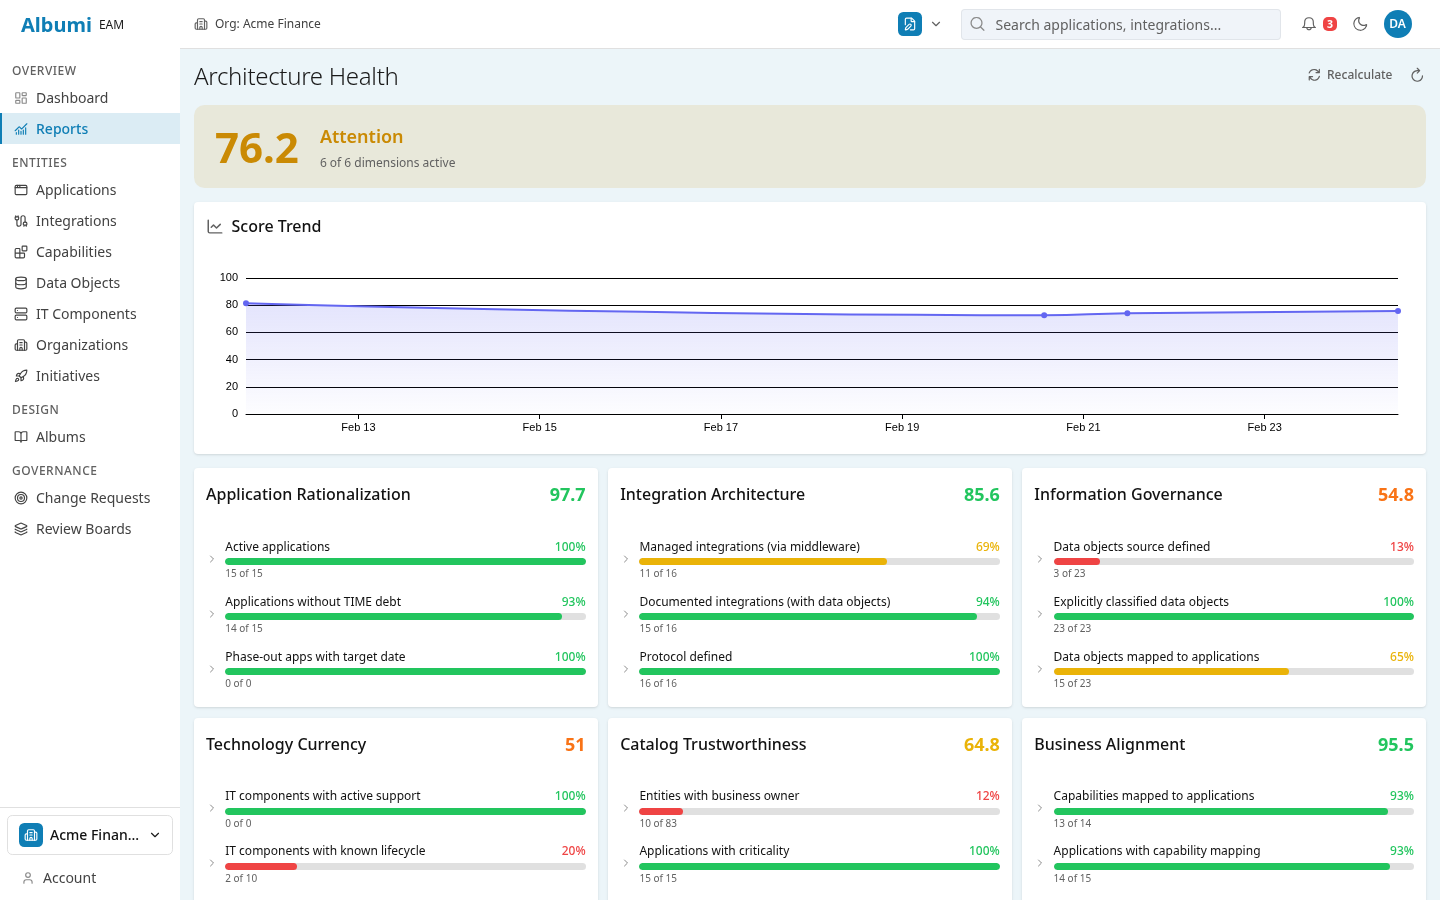
A single-screen overview of your IT landscape's state — how healthy is your portfolio, how many systems are being retired, where is technical debt concentrated. The dashboard computes everything from your actual architecture data. No manual report building.
Architecture Health Score
A single number that summarizes the health of your architecture — computed from lifecycle status, TIME classifications, integration coverage, and documentation completeness. Track it over time to see if your architecture is improving or degrading.
Lifecycle Distribution
See how many applications are in each lifecycle stage — Plan, Phase-In, Active, Phase-Out, End-of-Life. A healthy portfolio has most applications in Active with a manageable number in Phase-Out. Too many in End-of-Life? That's your technical debt backlog.
TIME Classification Breakdown
How many applications are you investing in vs. tolerating vs. eliminating? This is the strategic view your CTO needs — portfolio direction at a glance, without opening a spreadsheet.
Applications by Organization
See which teams own the most applications, which have the most end-of-life systems, and where ownership gaps exist. This drives the conversation about responsibility and resource allocation.
Portfolio Overview Metrics
Total applications, integrations, data objects, and business capabilities — your landscape in numbers. "We run 127 applications with 340 integrations" is the starting point of every architecture conversation.
In Practice
Decommissioning a Legacy CRM
You need to retire the legacy CRM. Run impact analysis and instantly see: 12 integrations connect to this system, 5 applications depend on its data, 3 data objects (Customer, Contact, Opportunity) use it as System of Record, and the "Customer Management" business capability will lose one of its supporting applications.
Risk level: High. You now have a concrete scope for the decommission project — not a vague "we think it's connected to a few things." The project manager can plan timelines, and the architecture board can make an informed decision.
Quarterly CTO Review
Every quarter, your CTO asks: "How's our IT landscape looking?" Instead of building a PowerPoint over 3 days, you open the dashboard. Health score is 72 (up from 68 last quarter). 8 applications moved from Phase-Out to End-of-Life. 3 new applications were onboarded. The Finance team still has 4 "Eliminate" applications with no migration plan.
The conversation shifts from "what's the status?" to "what should we prioritize?" — which is where the real value is.
Works Together With
Application Portfolio
Run impact analysis on any application, see lifecycle and TIME data on the dashboard, and visualize dependencies on diagrams.
Integration & Data
Every edge on the integration map and every data flow in the lineage graph comes from your integration catalog and data objects.
Governance & Initiatives
Track how strategic initiatives are changing your portfolio health and use impact analysis to evaluate proposed changes.
See Your Architecture Clearly
Impact analysis, live diagrams, and health dashboard — sign up for early access.
Get Early Access